How we helped our client to transfer legacy pipeline to modern one using GitLab's CI/CD - Part 3
Please dive in the third part of a blog series based on a project delivered for one of our clients. Please click part I, part II to read the…
Read moreAt GetInData, we understand the value of full observability across our application stacks.
In this article we will share with you our experience from running observability stacks on kubernetes hosted on public clouds and on premise environments. All presented with interesting use cases.
Each new implementation provides valuable experience which we use to improve the next one.
This allows us to continuously extend our stack to be more efficient, flexible and robust.
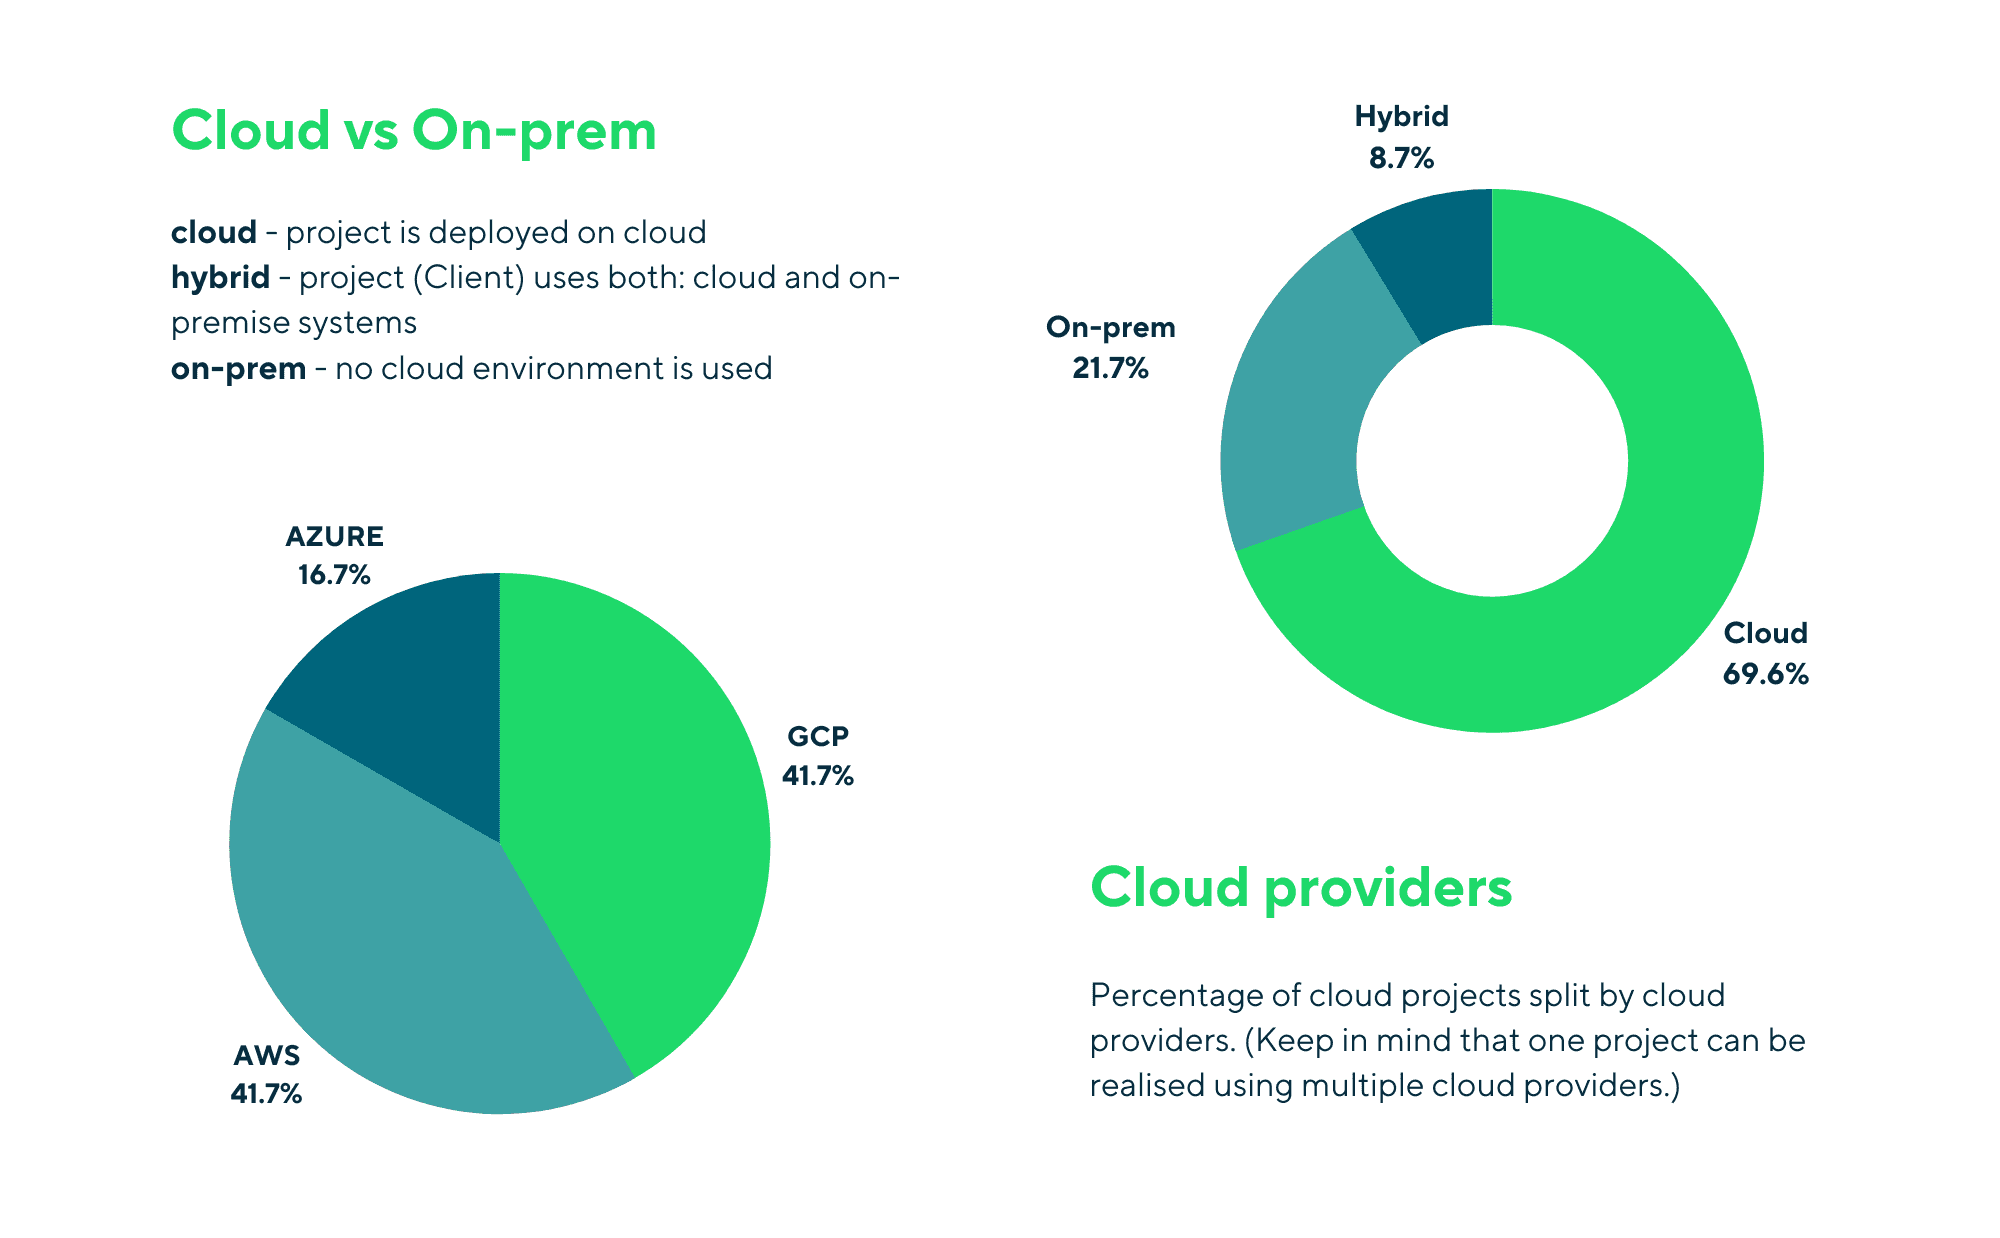
Currently, more than half of GetInData active projects are those where we manage observability stacks completely, meaning we design, implement and maintain the monitoring, logging and tracing of our application stacks:


Now, let’s talk about some interesting use cases we have encountered along the way.
We will divide them into the following areas: deployment, operation and performance.
How should you deploy your monitoring solution properly?
A single pane of glass for all your prometheus deployments? Yes, it’s possible!
Thanos can integrate multiple prometheus instances without any additional components.
But there is more:
But what does it mean exactly?
There are plenty of tools out there but as always, some of them are better than others.
Based on our experience, we recommend our version of LGTM stack:
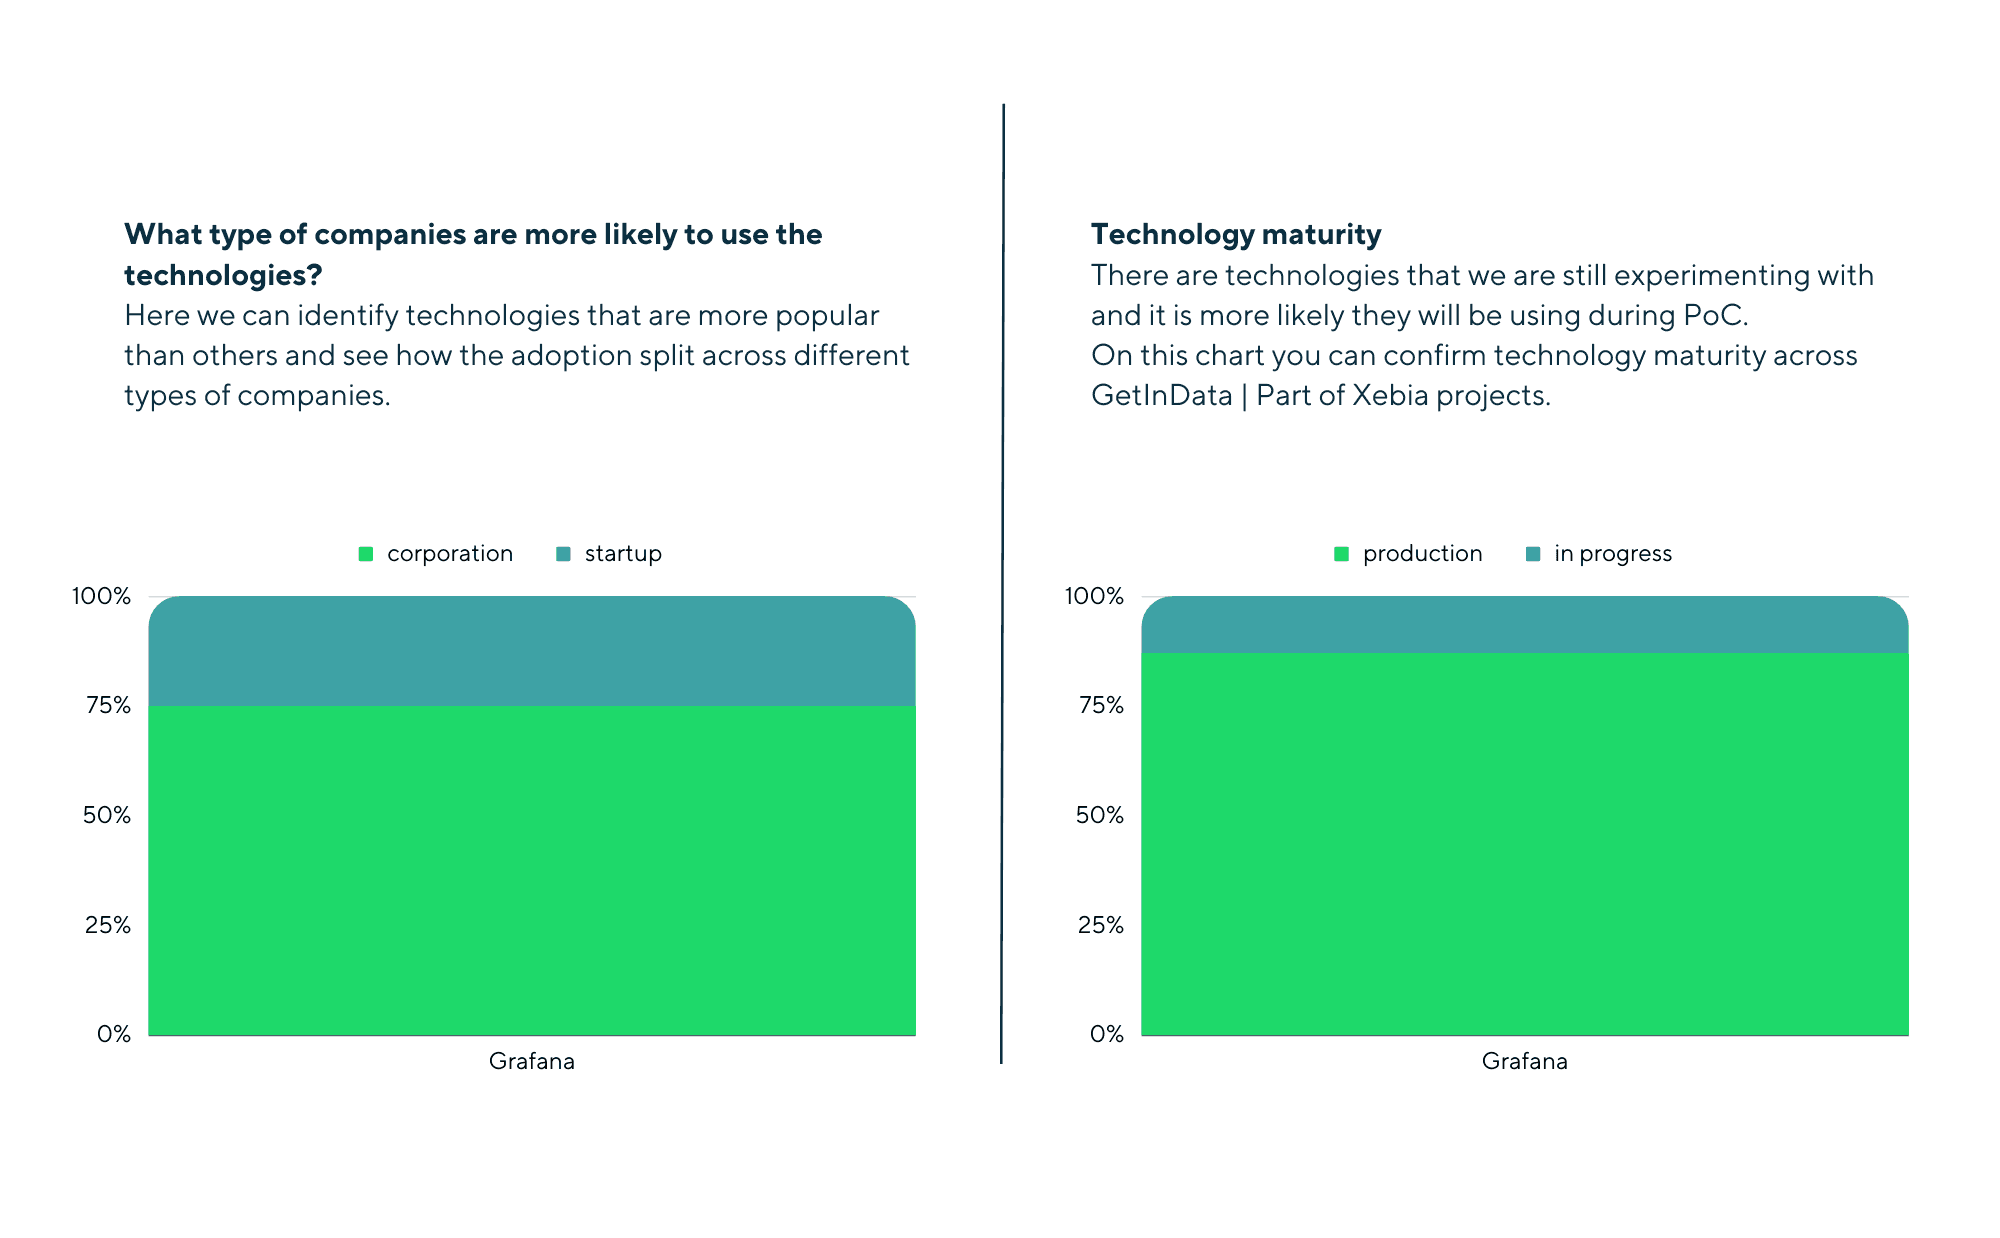
The Grafana users community is one of the largest out there for a reason:
How should you operate and/or upgrade your monitoring solution correctly?
Making your configuration changes a part of your CI/CD pipeline is highly recommended.
Tasks to consider for your CI/CD pipeline are:
This way you can focus on the real value of your changes instead of wasting time on manual verification and applying your code.
For example, Grafana publishes a new minor version every two weeks.
Having the possibility to continuously upgrade your apps without downtime is crucial.
In the kubernetes world, the storage class access mode heavily impacts this upgrade process.
As the name ReadWriteMany suggests: it supports read and write capabilities for multiple clients at the same time.
And this is exactly what will be needed during the rolling upgrade of your Grafana pods with previous and new versions: the ability to write to the same volume at the same time.
Another use case where storage class with ReadWriteMany capabilities is recommended is during kubernetes node failure. When this happens, kubernetes will try to reschedule your Grafana pod to another node together with the corresponding persistent volume.
Unfortunately, for storage classes without the RWX capability, your Grafana pod won’t be able to start as kubernetes will still see its persistent volume as being used.
Selinux is a security enhancement available by default on RedHat family distributions.
It increases the overall system security by decreasing the probability of a single operating system getting compromised.
Because of that, the combination of running your kubernetes workloads on premise, together with Selinux enabled is still a common scenario for high security institutions like banking or government institutions.
While using kubernetes, Selinux installed on your nodes is also used in pods and persistent volumes. Unfortunately, a quite recent version of kubernetes is required in order to fully support Selinux for persistent volumes: v1.24 or higher.
Imagine your Grafana for all prometheus instances you deployed over all those years. Do you remember all the tiny configuration changes you made to quickly fix something?
Of course not!
The solution is simple: include Grafana dashboards configuration in your CI/CD pipeline:
How should you optimize your monitoring solution?
Storage is crucial to overall system performance.
Even the best applications won’t perform while running on slow storage.
In the kubernetes world, the above statement still applies: each application pod using persistent volume will reflect the performance of the storage class configured underneath.
Surprisingly, using faster volumes doesn’t mean higher costs.
Many cloud providers offer attractive prices for faster storage, making it an easy choice from both cost and performance points of view.
For example, in AWS, you can reduce your storage costs up to 50% by simply migrating from slower General Purpose 2 (gp2) to new General Purpose 3 (gp3) SSD volume type.
In this post I have shared our experience with you in running observability stacks on k8s.
I hope you found it useful.
If you want to know more about our observability stack, please check the following blog post where I described its architecture in more detail: Running observability stack on Kubernetes.
Please dive in the third part of a blog series based on a project delivered for one of our clients. Please click part I, part II to read the…
Read moreAt GetInData we use the Kedro framework as the core building block of our MLOps solutions as it structures ML projects well, providing great…
Read moreIn this episode of the RadioData Podcast, Adama Kawa talks with Alessandro Romano about FREE NOW use cases: data, techniques, signals and the KPIs…
Read moreHTTP Connector For Flink SQL In our projects at GetInData, we work a lot on scaling out our client's data engineering capabilities by enabling more…
Read moreApache Sedona is a distributed system which gives you the possibility to load, process, transform and analyze huge amounts of geospatial data across…
Read moreLast month, I had the pleasure of performing at the latest Flink Forward event organized by Ververica in Seattle. Having been a part of the Flink…
Read moreTogether, we will select the best Big Data solutions for your organization and build a project that will have a real impact on your organization.
What did you find most impressive about GetInData?